
A Pandemic of Confounded Variables
A Pandemic of Confounded Variables
and the danger of napping

We’ve had a “pandemic of the unvaccinated”, unexpected “breakthroughs”, Presidents and elite Directors with 4 shots and “rebounds” using miracle medications.
We have a problem. Rubbish trials and rubbish data with confounded variables. I’ll explain “confounding” in this article. At the end of the article something more lighthearted.
Twitter handle @LCHF_Matt has created a dashboard in PowerBI and done an excellent job. It is based on data from the NSW surveillance reports. It shows the benefit of being able to cut through data in different ways. There have been a lot of posts on the recent data from New South Wales (NSW) in Australia showing numbers and rates of COVID hospitalisations for different vaccination categories. In fact people round the world, who had not heard of the state in Australia NSW, now know it.
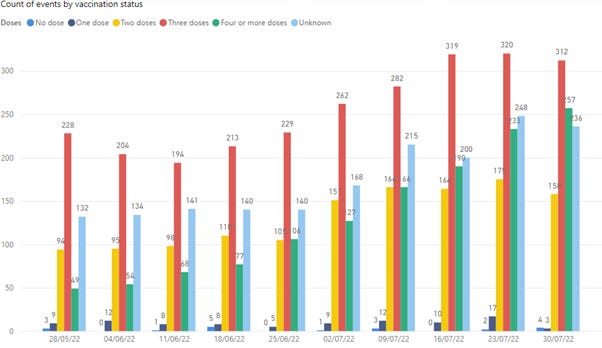
The graph below is the most recent update from the app, at time of writing, for weeks ending 28 May 2022 to 30 July 2022. Rates of Hospitalisation, including ICU, against vaccination status, shown in colour, for 10 successive weeks, is shown below:

The green is 4 doses and if you are interested in whether a second booster is helpful this is an instructive graph. Remembering that evidence for benefits of boosters was always thin, based on Israel data, and there was FDA committee member disagreement. FDA committee members resigned. They were Marion Gruber, director of the FDA’s Office of Vaccines Research & Review, and deputy director Phil Krause.
A spot check of numbers in the NSW Surveillance reports shows that the numbers used in the dashboard are right. In graph above 4 dose does not appear in 28 May data and when I checked I think this is because the percentage of 4 dose in the population was not available to make the calculation. In Australia, on 25 March 2022 a 4th dose was eligible to all over 65 and on 11 July eligibility was extended to all over age 30.
The rates in the graph above are calculated based on published vaccination rates, across all ages, in NSW. And this is where it gets complicated. Older ages in Australia are up to 99% vaccinated. Unvaccinated percentages are weighted towards younger ages, where people rarely get hospitalised from COVID.
This is not to say the graph isn’t a realistic representation of what’s going on.
The rate for “Unknown” is done against the whole NSW population of approximately 8M, so it’s really only there to get an idea of the relative size of this categorisation.
Dashboards during the pandemic have, more often that not, been useless presentations of irrelevant numbers. For example, the NSW dashboard below tells nothing about how well the health of the people of NSW is being looked after.

It’s obviously aiming to highlight high rate of vaccination and that we are therefore being kept safe.
There’s a thing in the data science community about the “death of the dashboard”, probably because of the irrelevance of most dashboards. But this app, developed by someone in the community, is useful and allows one to look at data in different ways. Looking at actual numbers, ie raw counts of hospitalisations, including ICU.
3 dose now becomes the largest, because there are more 3 dose people than 4 dose. Because the 4 dose is a relatively smaller population, the rate now goes higher compared to 3 dose.
There are hardly any “No dose”, medium blue bars, at the left of each of the groups of bars, but of course there are a small number of No dose people in Australia.
That there could be such a large number of “unknowns”, right most, light blue bar in each group, is astounding. If authorities don’t know status of people in hospital, particularly ICU, this is hopeless. My impression is that these will most likely be people of certain vaccination status 1,2,3,4 dose that could not be verified. If a person is no dose then there is nothing to check, unless No dose people are going into hospital claiming for example they have had 4 doses.
Now inspect for COVID deaths. The graph below shows COVID deaths, in raw death counts, by age group:
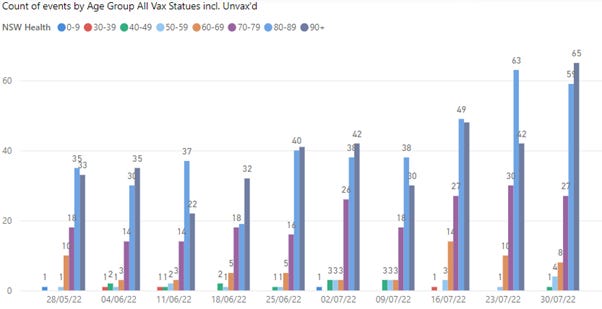
This graph makes clear what is known, ie that COVID deaths, in ages 80’s to 90’s, are by far the majority. With median age of death of approximately 83 years of age in Australia, many of these unfortunate deaths are above the typical age of death.
I’m not sure if it is intended but 10-29 age group is missing in the graph. It will be a small number in any case.
When looking by rate (of population in each age) for each age group the age effect is more stark:
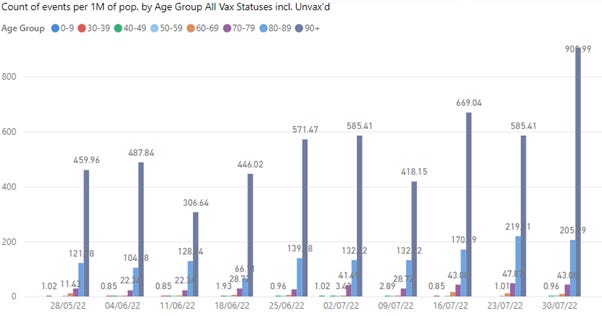
There is less population in the 90’s+ age, compared to lower ages, and this therefore amplifies the rate in comparison to lower age groups. Clearly the risk of death from or with COVID is age dependent.
Looking at these deaths, now by vaccination status, in raw counts (back to all ages):
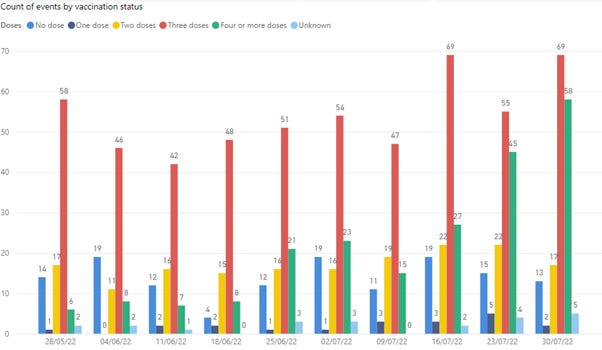
The red bars stick out. The majority of deaths are in the three-dose group. The medium blue, No Dose, is relatively higher than in other graphs. This could be an indication of benefit of vaccination in preventing death.
But something is not right. These deaths did not appear in the hospital system from the previous hospitalisation graphs. You can follow this in the NSW surveillance reports. What is going on?
This data is telling us is that unvaccinated deaths, are likely to be elderly frail people. They do not get admitted to hospital. Most likely they are dying in Aged Care facilities. They may be deaths “with COVID” rather than “from COVID”. The small percentage of elderly people who are not vaccinated may be made up of distinctly different cohorts. There are those where family may have chosen not to vaccinate because of the risk of adverse event from vaccination due to their medical condition.
There are also robust elderly people, who may be “conspiracy theorists” and it will take more than COVID to finish them off.
The most recent ABS data on COVID found here shows:
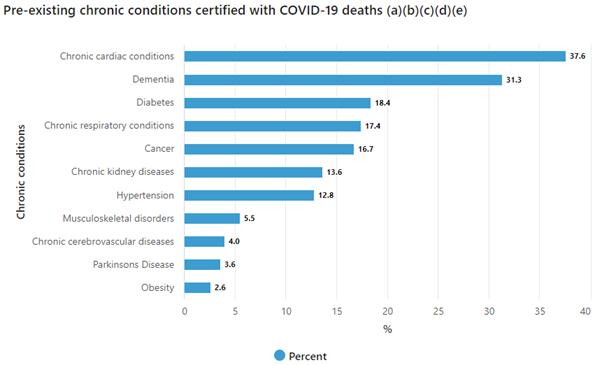
Almost 40% of COVID deaths have pre-existing cardiac conditions. 30% have dementia. Also from the ABS:
Most deaths due to COVID-19 have other conditions listed on the death certificate (93.9%). The table below shows that half of all certificates had both a causal sequence and pre-existing conditions listed on the certificate.
On average, deaths due to COVID-19 had 3.0 other diseases and conditions certified alongside the virus.
6% have COVID only on the death certificate.
USA Data
The so called “White House COVID Czar” Ashish Jha retweeted a post by an Edouard Mathieu, who it turns out is “Head of Data” at Our World in Data.


The Edouard Mathieu tweet contains a graph.


This corresponds to an Effectiveness of 96% for 4 dose compared to no dose. Whoah! Jha could be right “it may save your life”.
Vinay Prasad, who apparently has just been promoted to full professor at UCSF, wrote the following article:

criticising the post. He points out all the deficiencies from a trials point of view. This includes the fact that when an effect is shown that high, there is usually something wrong. Rarely in medicine are effects that strong.
I found the CDC data set that you can get here.
There are two age groups in the study ages 50-64 and 65+. So the data does not apply to young people. They calculate a crude rate and then do an age adjustment.
This Effectiveness figure of 96% is based on 21 people dying out of population of a selected population of 5.9M boosted, and 270 dying out of 6.5M unvaccinated. There is no information about the composition of the cohorts. Vinay Prasad details all the obvious limitations from the perspective of a clinical trials specialist.
One thing I’ve found useful is looking at all the responses in message threads, such as the tweet above. You get various points of view. Here everyone is onto the deception. The general consensus is that the data is rubbish and that it is outrageous that an organisation like CDC could refer to such data. The CDC loses all credibility.
People in the comments question why is this data different to everywhere else in the world? eg someone shows data in England where rates of death in vaccinated and unvaccinated are the same. The NSW data gets an honorable mention.
The most interesting one, which I didn’t think of, was someone pointed out that this data is collected over 30 months from the start of vaccination, so it includes previous waves including the Delta wave. Those double boosted can only have got that dose in the most recent 3 months of the dataset in the US. They obviously didn’t die in the 27 months before that. The comment points out that this risk exposure needs to be taken into account as the double boosted deaths would have been only over a 3 month period, whereas unvaccinated persons could have died all the way through from the start of vaccination campaign.
The person makes a calculation and says after that there is no difference 4 dose to no dose! So from almost 100% effective to 0% effective. I haven’t checked that claim myself. But I took a quick look at week to week data, which is a cumulative count. For the last two weeks of the data (week 20 to 21), unvaccinated deaths went from 256 to 270, ie 14 died. Double boosted went from 15 to 21, ie 6 died. So straight away, a real time measure, of what the effect is now, it’s nothing like the 96% claim for the effectiveness. It’s clearly rubbish analysis promoted by the CDC.
I looked another week back (week 19) and the unvaccinated number was 265. 265 had died one week and then 256 the next, ie it went down! 9 people came to life!!! This is probably some administrative correction, but all the same, something is not right.
One more contribution to the thread is someone looks up the credentials of the Our World in Data guy who posted this stuff. It turns out he is an “Agenda Contributor to the World Economic Forum”. So, there you go, is it any wonder that people questioning data have become tagged as conspiracy theorists?
Oh well what can we do?
I should go back to my legacy news feed to numb my mind. But then I came across the following alarming article:

In Australia we were presented this week with another warning of why we might suddenly die. Looking into the study, napping regularly was linked to high blood pressure. And high blood pressure that can lead to strokes and heart attacks.
Looking a little closer we find that in the study those who napped suffered from other ailments. The people usually suffered insomnia, some had sleep apnoea. They also were more likely to smoke and drink. OK, so it’s the napping that is killing people?
It’s an example of what is called confounding variables. That’s when you are trying to predict something based on a variable that is not actually the thing driving the response. It causes all sorts of problems in data analysis.
A silly example, that is used to teach about confounding variables, is sales of ice creams at the beach and incidence of shark attacks. There is supposed to be data that shows a positive correlation. Increased ice cream sales leads to more shark attacks. The thing is there is another variable that should be in play. That is the weather. If weather is warm then more people will be at the beach and therefore more ice creams sold. More people at the beach means more likelihood (albeit small) of shark attack.
The relevant variable is the weather/temperature. The ice cream is irrelevant. Same with the napping. It’s not the napping. Smoking, drinking, not sleeping well could be the problem.
At the start of my article, we found something strange, where the unvaccinated people dying did not go to hospital. We know that those who die they are likely to be older. There are very few in Australia in the older age groups who are not vaccinated. What I suspect is that these unvaccinated people, who unfortunately died, are elderly, possibly with dementia that there has been a conscious decision not to vaccinated for fear of adverse reaction.
The vaccination variable probably has nothing to do with risk of dying for this cohort. Age and medical condition creates a far higher risk.
These are variables that need to be split out to really tell what is going on. Same thing for the rubbish US data. The 4 dose people are more likely to contain the wealthy, laptop class. All the data may be telling us is that we are looking at different groups of people.
Back to the napping study, we dig into who did the study? I hope it’s not the World Economic Forum again. The study apparently comes from Xiangya Hospital Central South University, main author Dr Wang. The study used UK data with people aged 40 to 69 years. So, this is a Chinese study on older UK people, alarming people in Australia. Hmmm. Where is this University?

Central China just South of Wuhan.
There are amusing comments to the article, someone saying they were not vaccinated so they were not worried about dying suddenly and were therefore going to have a little nap.
To wrap up, if you need a laugh after all this convoluted discussion, please have a look at this youtube video, a friend sent me a link to, of a recent show by comedian Jim Breuer - 'Somebody Had to Say It'.

The first 10 minutes is priceless. He captures perfectly the stupidity of much in the last few years. I haven’t laughed this much for a while.
Thanks for the Jim Breuer clip, it's heartening to see that not every one falling for this scam.
If you can handle some poorly conceived music, I did start looking at some of the all-cause mortality stats about 10 months ago and included them into a clip for one of my tracks. I'd never made a video before (or again since) so it's not the greatest.
If the music is not to your taste, the stats start at about 4:20
https://vimeo.com/620536885