Data Chaos - Part 2
The Unknowns

My last article highlighted limitations with any inferences drawn from a recent AIHW report. Problems include:
analysis is based on a sample whose representativeness of the overall population is unknown;
we don’t accurately know the true proportion of people in different dose categories, particularly the zero dose category for older ages;
there are clear differences in makeup between the constituents of the dose categories being compared;
people with different underlying health conditions are driving the results, irrespective of other factors like number of doses.
The bottom line is that controlled trials are needed to make reliable conclusions. The recent Florida analysis is an example of how this may be done, where the variable used for comparison, in this case the vaccine brand, compares groups of people with characteristics matched as far as possible.
I see that Steve Kirsch, in a recent article, tries to make an estimate of “the healthy vaccinee effect”, using the individual record level Czech data. It is observed that the people getting more jabs (eg 3 vs 2) tend, in general, to be healthier. This is seen by a lower rate of all-cause mortality during periods when covid is not prevalent. There are many reasons for this. Sometimes they are wealthier, which is an indirect predictor for health.
From my reading of Kirsch’s post, the idea is to start from a period where everyone who is getting a jab, has one and then find a period where there is no covid mortality and look at the difference in all-cause mortality rates of the groups with different doses. You can use this to compensate. I’m not sure how well this will work because I think that the generalisation may still not be valid. Within one dose group there are so many different kinds of people. The example I gave last article was for zero dose where we have a small subgroup of healthy individuals who made a conscious decision themselves not to get jabbed. Then we have very sick frail people where the decision was made for them to either get or not get the jab. Without controlling for these other variables, the analysis is useless.
Thanks also to the reader who commented on my last article re the one dose group in Australia. There were some people in Australia who did not want any dose, but got away with getting one dose only to keep their jobs. They may be people with good underlying health. Others in the 1 dose group could have had health severely impacted by that dose or have had poor health to start with.
I will show in this article that the number of people in older age groups who did not get any jabs is very small relative to the population of the age group. And it seems that the number is actually less than the number who are said to have had a covid diagnosis with zero dose, from the AIHW linked dataset.
The majority of covid deaths are people in the 80’s and 90’s. The proportion of people in those ages who are unvaccinated is tiny. Trying to make comparisons with this small group, that includes some extremely robust and healthy people and some very close to death, is absurd.
Let’s try to work out how many people are really unvaccinated, ie zero dose, in these ages. What does the AIHW report tell us? We look to the AIR.
Australian Immunisation Register (AIR)
As I understand it, no one records zero dose in the AIR. There is just no record of any covid vaccination, and so 0 dose “is assumed”.
I can’t find any information on how many people are in the AIR. It was built on the infrastructure of Medicare, which is estimated to include 99% of the population. A reference on the AIR by AIHW, found here, states:
Reporting of adult vaccinations to the AIR was mandated in July 2021 for vaccinations provided under the National Immunisation Program, for influenza and for covid-19, and in December 2022 for Japanese encephalitis virus vaccines. Reporting of other vaccinations is not mandatory.
So in the midst of the pandemic it was “mandated” to enter adult vaccinations into the AIR, whatever that means.
Practical information for the public on the AIR is found here from Services Australia. It states:
You can’t update the AIR. Only a recognised vaccination provider can update the AIR. This includes doctors, such as a general practitioner or community health centre. You’ll need to ask your vaccination provider to do this.
There are a few ways they can update the AIR. One way is using the AIR site. If they use the AIR site, you’ll see changes to your immunisation history statement straight away.
The site also explains here the process to update one’s own AIR record if a certain vaccination is not appearing in the History statement. So clearly there can be issues with the AIR correctly reflecting the status. If names don’t match the AIR record name, it won’t be updated with the vaccination. I imagine there would be issues with names changed at marriage not matching.
People can choose to not to allow their AIR record be shared with third parties, even GP’s. This is called Opt Out. Privacy rules are explained here. Even if one Opts Out, and has some vaccination, the AIR is still supposed to be updated:
For COVID-19 and influenza vaccinations, the recognised vaccination provider will be required by law to report information to the Register.
I’m not sure if you can have your name removed completely from the AIR. I think if one has a Medicare account there will be an AIR entry. Bottom line is that there are a lot of complexities for any system such as this. We have to keep this in mind when we are using this data. Asking ChatGPT: In the Australian Immunisation Register how many people are recorded?
ChatGPT said:
The Australian Immunisation Register (AIR) is a national register that records vaccines given to all people in Australia. It was established in 1996 as the Australian Childhood Immunisation Register and expanded in 2016 to include individuals of all ages. Reference here and here. While the exact number of individuals recorded in the AIR is not publicly specified in the available sources, the register aims to include all individuals who have received vaccinations in Australia. This encompasses vaccinations administered under the National Immunisation Program, as well as those given privately, such as for seasonal influenza or travel. Reference here.
Health professionals are required to report administered vaccines to the AIR, ensuring that the register maintains comprehensive and up-to-date records. Reference here. If you are seeking specific statistical data or detailed reports from the AIR, authorised vaccination providers can access these via the secure area of the AIR site. Reference here.
Other links are provided. From the National Centre for Immunisation and Research Surveillance (NCIRS), Annual Immunisation Coverage Report 2023:
Participation in the AIR is ‘opt-out’, and so the AIR constitutes a nearly complete population register for Australian residents. Ref 46.
The reference is titled: “Measuring immunisation coverage in Australia: a review of the Australian Childhood Immunisation Register”. It is only on childhood vaccination coverage. Before covid, all the focus on vaccination coverage, was for children.

from Department of Health and Aged Care concludes:
Conclusions: Vaccination coverage in children and adolescents remained relatively high in 2021, although with some evidence of COVID-19 pandemic impacts, particularly on receipt of two doses of HPV vaccine within the same calendar year. It will be important to ensure catch-up vaccination in children and adolescents occurs. A strengthened focus on adult vaccination is needed, as coverage remained suboptimal in 2021. The impact of mandatory reporting of all NIP vaccinations from mid-2021, on completeness of AIR data, has not yet been formally evaluated.
…
By the end of 2021, a total of 91.6% of people in Australia aged 16+ years had received a second dose of a COVID-19 vaccine (71.8% for Indigenous), with over 99% of those aged 70+ years having received a second dose.
Emphasis above is mine. Therefore: We know nothing about the completeness of the AIR records, especially for adults, and in particular older adults and for covid.
I found this National Audit Office report, regarding immunisation coverage, dated September 2021. The Audit Office provides a very important function. It is interesting reading. Amongst the conclusions:
The performance measures for immunisation coverage are not fully adequate and, while Health has taken some action to assess performance, it does not systematically address issues raised in evaluations and program assessments.
It is clear that it is possible that people, who are covid vaccinated, do not have their records in the AIR up to date. I expect this is less likely for younger people who needed vaccine certificates to work or do anything. For older people, say in a low-quality aged care facility, it may be possible that no-one bothers to update a health record, even though it is now deemed “mandatory”.
Another insight into how reliably the AIR is updated is found in this report from Australian vaccine researchers.

Abstract
The accuracy of data recorded in the Australian Immunisation Register (AIR) is important for assessment of population-level vaccine coverage but has not been assessed nationally since 2001. We undertook a cross-sectional study in five states in 2017 using standard criteria to validate AIR records classified as three months overdue for any vaccine at 12, 24 and 48 months. Of 2,000 records selected for audit, 905 were assessable, of which 124 (14%) were misclassified as overdue (errors). Among 563 general practice (GP) records, 91 (16.1%) were errors.
So, in this very small audit sample, 16% of doses from a GP were in error. This potentially led to children getting duplicate doses. Factors looked at are how the AIR record was updated: Practice Management Software or paper forms, provider type: GP or public sector, location: remote or not. Largest errors were via paper forms, GP and remoteness. The report also references this study from 2018 on data transfer error rates to the AIR. Again, this is focused on children. We have no idea how accurate it is for doses delivered in aged care facilities.
So this is all useful background to understand what can go wrong with the raw data used in the AIHW study.
Linkage Rates
AIHW has a report on the linkage rates of the various databases linked found here. This is showing the number of records from the covid-19 registered positive tests that match up to other relevant data tables. For over 70’s there are 6% that don’t match up and so we assume they drop out of the analysis.

The linkage rates have been improving each iteration of the register. If data is dropping out it’s sort of OK so long as what drops out is distributed in the same way as the rest of the data. We have no idea whether this is the case. There may well be a bias introduced here.
Review of other publicly available data
Government reports I previously referenced state over 99% of people over 70 years have had two doses. In other words, less than 1% of this age group are assumed unvaccinated. This age group is where the majority of deaths are occurring. Therefore, the actual percentage is pretty important to know accurately, particularly if comparisons on covid outcomes are being made. Let’s see if this matches up with other numbers we can get hold of.
From the covidbaseau aggregator site (not updated since end 2023) useful tables and graphs on covid vaccine uptake are provided. It also provides age breakdown by state. For 1 dose:

Have a look at the AUS column, with percentages up to 115%. What’s happening to these extra doses? This discrepancy is covered up in other categories by showing >95%. For 2 doses:

I have always found it interesting that the percentages for the 55-59 age group are down relative to neighbouring age bands. I assume that these are people close to retirement that may have made the decision that the risk was not worth it, and early retirement was preferable. For younger ages it was difficult to avoid mandates, without severe financial repercussions.
For percentages greater than 100%, part of the problem, I think, is the population used to calculate these percentages. If we look at the official Department of Health data, found here for the end of 2022, which is provided in the form of Powerpoint slides:

No raw datasets provided which is poor data transparency. Looking at the footnote, the definition of coverage is using the June 2021 Estimated Residential Population (ERP). By the end of 2022 the population is going to be larger and therefore the actual percentages lower. So maybe this takes into account why there are percentages greater than 100%. They cover up the nonsense percentages by showing >99% in this case.
I think the reason for using the 2021 ERP is because this is considered an official confirmed number tied to a census. The ABS really does a superb job in curating population data. A detailed description of methodology is found in ABS pages here and here. The June 2021 estimate is currently considered a “final”. ABS documents how they make updated estimates over time in good detail. So, assuming their updated population estimates are accurate we can use relevant population data to make a better estimate of the percentages.
I’m not sure where the aggregators sites got their data on vax doses in age bands and States, as this is not made publicly available, as far as I can tell. The data is indirectly provided in the public reports but only in graphical format, eg as below.
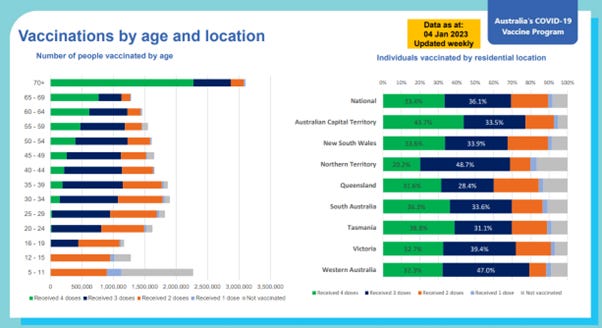
In the early days of the pandemic I went to the laborious task of digitising the graphs to work out numbers roughly. It’s ridiculous to have to do that. Quick check on the age 65+ number above at end of 2022, the previous slide shows:

We can see the population shown is greater than the number of dose 1’s. Using ABS quarterly estimate of the population:

At the end of 2022 the estimate is 4,500,816. In that case the percentage is 4,381,818/4,500,816x100%=97.4%.
So approximately 2.5% unvaccinated over 65. It seems the estimate in the government reports, ie <1% for over 70, was lazy. We expect a much smaller percentage in the older age bands of interest 80’s and 90’s.
Senate Estimates Question
Through a Senate Estimates Question on Notice, data was requested for age and state breakdown of vaccination coverage. We therefore have access to numbers of doses in age bands. The percentages calculated have the same problem with the use of the 2021 ERP, but we can try to fix this estimate by using the ABS population estimates for the relevant period. It turns out to be tricky. I’ll explain why.
The question is: when are people in the specified age band? The extract was performed in April 2024. The people in a particular age band actually changes day by day. People come into the band and people drop out as they have birthdays. I hadn’t thought about this until I tried to do calculations and things didn’t make sense.
The Senate Estimates extract of vax doses is specified to have been performed with age calculated as the age at which the extract was done, ie April 2024. So, if we are given the number of doses in a particular age band – at the time of the extract - at a particular month in the past we have to take this into account. Two years earlier than the extract, in April 2022, the relevant age band for the population will be people Aged 78-87. Their age in April 2024 is 80-89.
We can find the population for the first quarter of 2022, for people age 78-87, from ABS public data. For Q1 2022 this is 1,079,451.
From the Senate Estimates vaccination data, in April 2022 for the 5-year age bands:
80-84 number of people at Dose 1 is 657,106
85-89 number of people at Dose 1 is 429,603
The total doses is 1,086,709. That’s still more jabs than the relevant population we have calculated above, ie 1,079,451. Maybe the relevant population is in error? At the next quarter, June 2022, it will be slightly larger. For Q2 2022 population estimate is 1,089,815. This would leave 1,089,815-1,086,709=3,106 people with 0 dose.
Could the number of jabs could be in error? Maybe they get dispensed and counted and then not delivered into arms? So the number counted is bigger than reality? But if they are counted as registered for individuals from the AIR there shouldn’t be extras. Rather we expect doses missed. For someone who dies shortly after dose 1, we ask whether a budget nursing home bother updating the AIR? Also, in stretched remote areas we know there are more errors updating AIR records according to reports referenced above. So, it’s quite possible the number of doses counted is smaller than it is in reality. But that makes the discrepancy worse when compared to the estimated population. Maybe during this time if more people are dying from all causes as we know happened starting from 2021 there is error creeping into the ABS population estimates?
That leads to the question for the vaccination numbers extract as to how have they handled people dying? The ABS population estimates take into account people dying. Does the extract of doses for each month take out jabs given to people who have since died? That could be a reason jab numbers are higher than they should be? Given what we have seen in the laziness of some Senate Estimate Questions responses in the past it is quite possible this hasn’t been taken into account.
The further I look into this you can see that doing this work properly is non-trivial. Unfortunately, due to uncertainties the AIHW analysis is not reliable. The report also assumes broad aggregations are valid. It’s clear that any analysis has to be done at the record level and take into account timings.
Ignoring the potential mistake handling dead people, my estimate of the number of people in the 78-87 years age band with no dose is small compared to the total population for that age band. An estimate of 3,000 in a million is less than half a percent of that population.
Back to the AIHW Report
We now look at the number of covid diagnoses, in the 80-89 year age band, in Figure 6 from the report.

This graph, when we choose option to show numbers rather than per cent, tells us that 9,881 people aged 80-89 with 0 dose had a positive covid test.
What?
We estimated that the number of people with zero dose in this age band, were 3,000 in number, possibly less. Noting that was for a slightly younger age band 78-87.
From Figure 1 of the AIHW report we know that the sample in the 80-89 years age group was 23% of the total population of that age band.
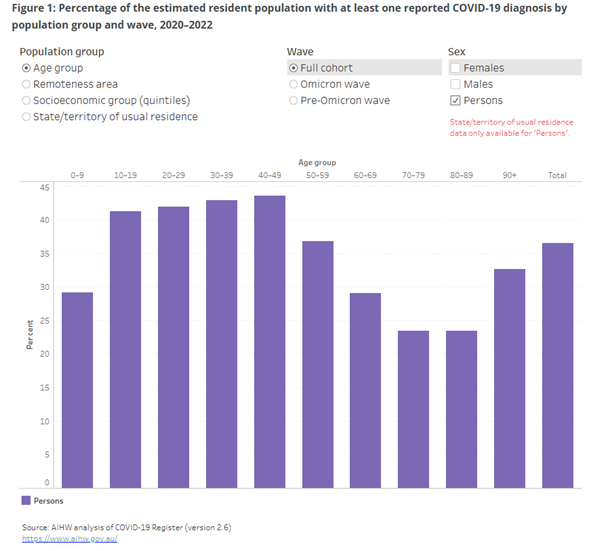
23.4%, of the Australian population ages 80-89 years (which we understand excluded WA) had a registered covid diagnosis up to the end of 2022.
22.9% for Omicron only. So a small percentage (0.5%) of the total population of ages 80-89 caught covid pre-Omicron.
Let’s check what is the Estimated Residential Population (ERP) they are basing this on? The ABS ERP for ages 80-89 at Q4 2022 is 913,438. For WA only it is 90,177, making the relevant ERP 823,261. 0.5% of 823,261 is 4,116 people.
Trawling through the data spreadsheet, provided with the AIHW report, we find some extra numbers for covid diagnoses. For ages 80-89, during Omicron only, it tabulates the number of covid diagnoses as 7,800. That makes it 9,881-7,800=2,081 for pre-Omicron, different to the 0.5% we estimated above. Why this discrepancy? There are some technical notes to the Figure 1 graph which could explain the discrepancy.
Notes:
People are counted in each wave based on their first reported COVID-19 diagnosis date.
Total includes people with missing data on sex but excludes people with missing information on age/remoteness area/socioeconomic group. Total for state/territory breakdown includes people usually resident in Western Australia and Other Territories notified through participating jurisdictions and people with missing geographical data.
It’s confusing. The report really gives us no idea about uncertainties in the data. So, even if we assume the covid tests caught every 0 dose person in this age group, there appears to be more people in the zero dose group than there are people who did not receive a dose. This tells us what we suspected:
The zero dose group is in reality an unknown dose group.
Clearly there are a lot of uncertainties in the simple estimates I have made. The number of 0 dose covid diagnoses, although small in number, appears to include before the jabs were available. That makes it even more of a nonsense. Irrespective, it is irresponsible to be making headline statements in the AIHW report that older people with 0 dose are 4 times more likely to be hospitalised, when it is clear that we have no idea how many people in older ages are unvaccinated. And even if we did know they are a very small population we are comparing with a large population of completely different people.
I could try and make similar estimates for other older age bands, but it seems a useless exercise. The National Audit Office report highlighted the need for improvement in the monitoring of the AIR. A full audit is required to get to the bottom of this.
Any inferences made like “people with zero dose are more likely to die or be hospitalised” is not supportable from this data.
A quote from Shakespeare came to mind while going through this.
Something is rotten in the state of Denmark
It is a line from the play Hamlet. An officer of the palace guard says this, after the ghost of the dead king appears, walking over the palace walls. We have unknown 80-year-olds mysteriously walking over the palace walls
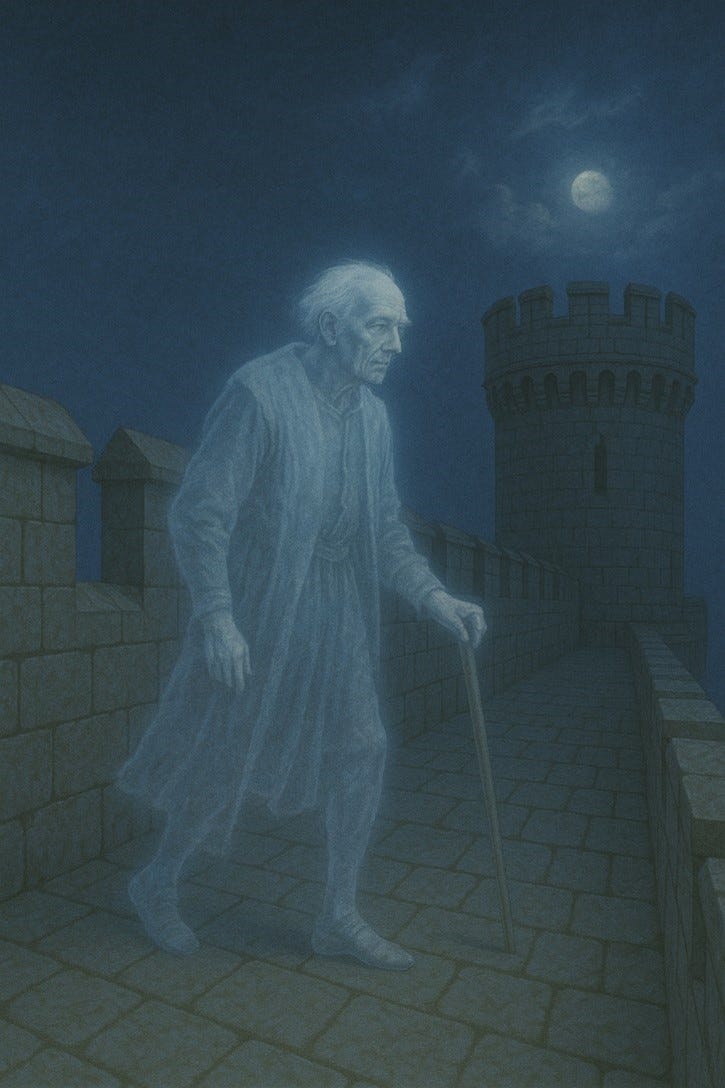
It seems that AI thinks the unvaccinated 80-year-old is a male. It’s more likely to be a female given the greater population of females at this age but maybe AI knows better?
Wrap-up
If you got this far - well done. I think it has been a useful exercise to understand why doing any analysis, trying to infer vaccine effectiveness, has to be done carefully. It’s really sinking in that the only way is with formal controlled trials. It’s why in the Florida study, where they had access to the individual record level data, they chose to make a very specific comparison, ie the vaccine brand.
We have found that the 0 dose group must in fact be a unknown dose group. We also know that there has been no audit of the accuracy of AIR records for the elderly population in Australia. We have no idea how many people are in that group.
"As I understand it, no one records zero dose in the AIR. There is just no record of any covid vaccination, and so 0 dose “is assumed”."
However, you can have an exemption recorded in the AIR which is by proxy a 0 dose entry.
Complex. Thank you for sharing. I see that the Our World in Data website (run by the University of Oxford) on mortality statistics is down. I wonder if historical point of reference data will be shifted upward, given the website’s previously published mortality numbers (unprecedented) on countries such as Brazil, the Phillipines, Malaysia and Slovakia to name a few. ➡️ https://ourworldindata.org/grapher/excess-mortality-p-scores-average-baseline