
Excess Mortality in Australia
Excess Mortality in Australia
update for first half of 2022

Earlier in the year I wrote two articles about the Excess Mortality being seen in Australia. At the time data was available up till March 2022. Data is now available from the Australian Bureau of Statistics (ABS) till August 2022.
Arkmedic has just written a blunt assessment of the Excess Mortality data in Australia in his substack.
I will provide some extra insights in this article, while I work in the background on a more complete analysis.
As with all COVID data it is imperative that age categorised data is analysed because the effects of COVID are so age dependent. I previously focused on the first narrow band age range for which data was available, 65-74 years.
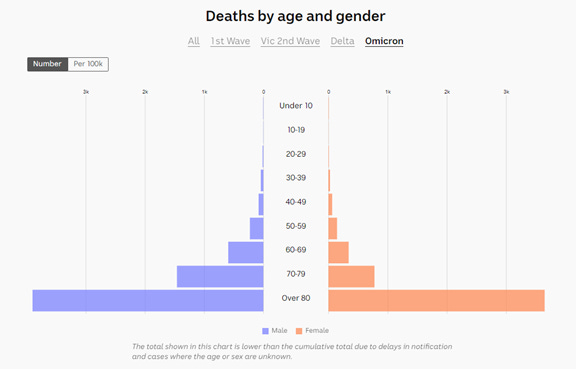
The ABS is now providing the number of COVID deaths per week so that this can be subtracted from the total deaths. If you read my earlier articles you may recall I had a challenge that government reporting on ages of death from COVID did not align with the mortality data. The ABS only provides total COVID deaths so to do age breakdown we still have the same issue.
I looked at one of the sources of COVID age of death I used, and I found it had given up. These sites have been aggregating data from government sites by cleverly scraping of data daily provided on the government sites. Unfortunately, the Australian government health departments do not provide properly curated datasets. You can’t even use the Wayback machine as they often provide data in tables or images that don’t get captured in the archive. Very frustrating. The problem is that the government sites keep changing the format and so the scraping program breaks. I explained all the gyrations I had to go through in the earlier articles. This time I have taken a simpler approach. I have taken the cumulative age breakdown of COVID deaths and applied an age percentage to the total COVID deaths across the period from January – July 2022.
Example from this source:
The cumulative excess deaths, excluding COVID deaths, for different ages in the ABS data since the start of 2022 is shown below.
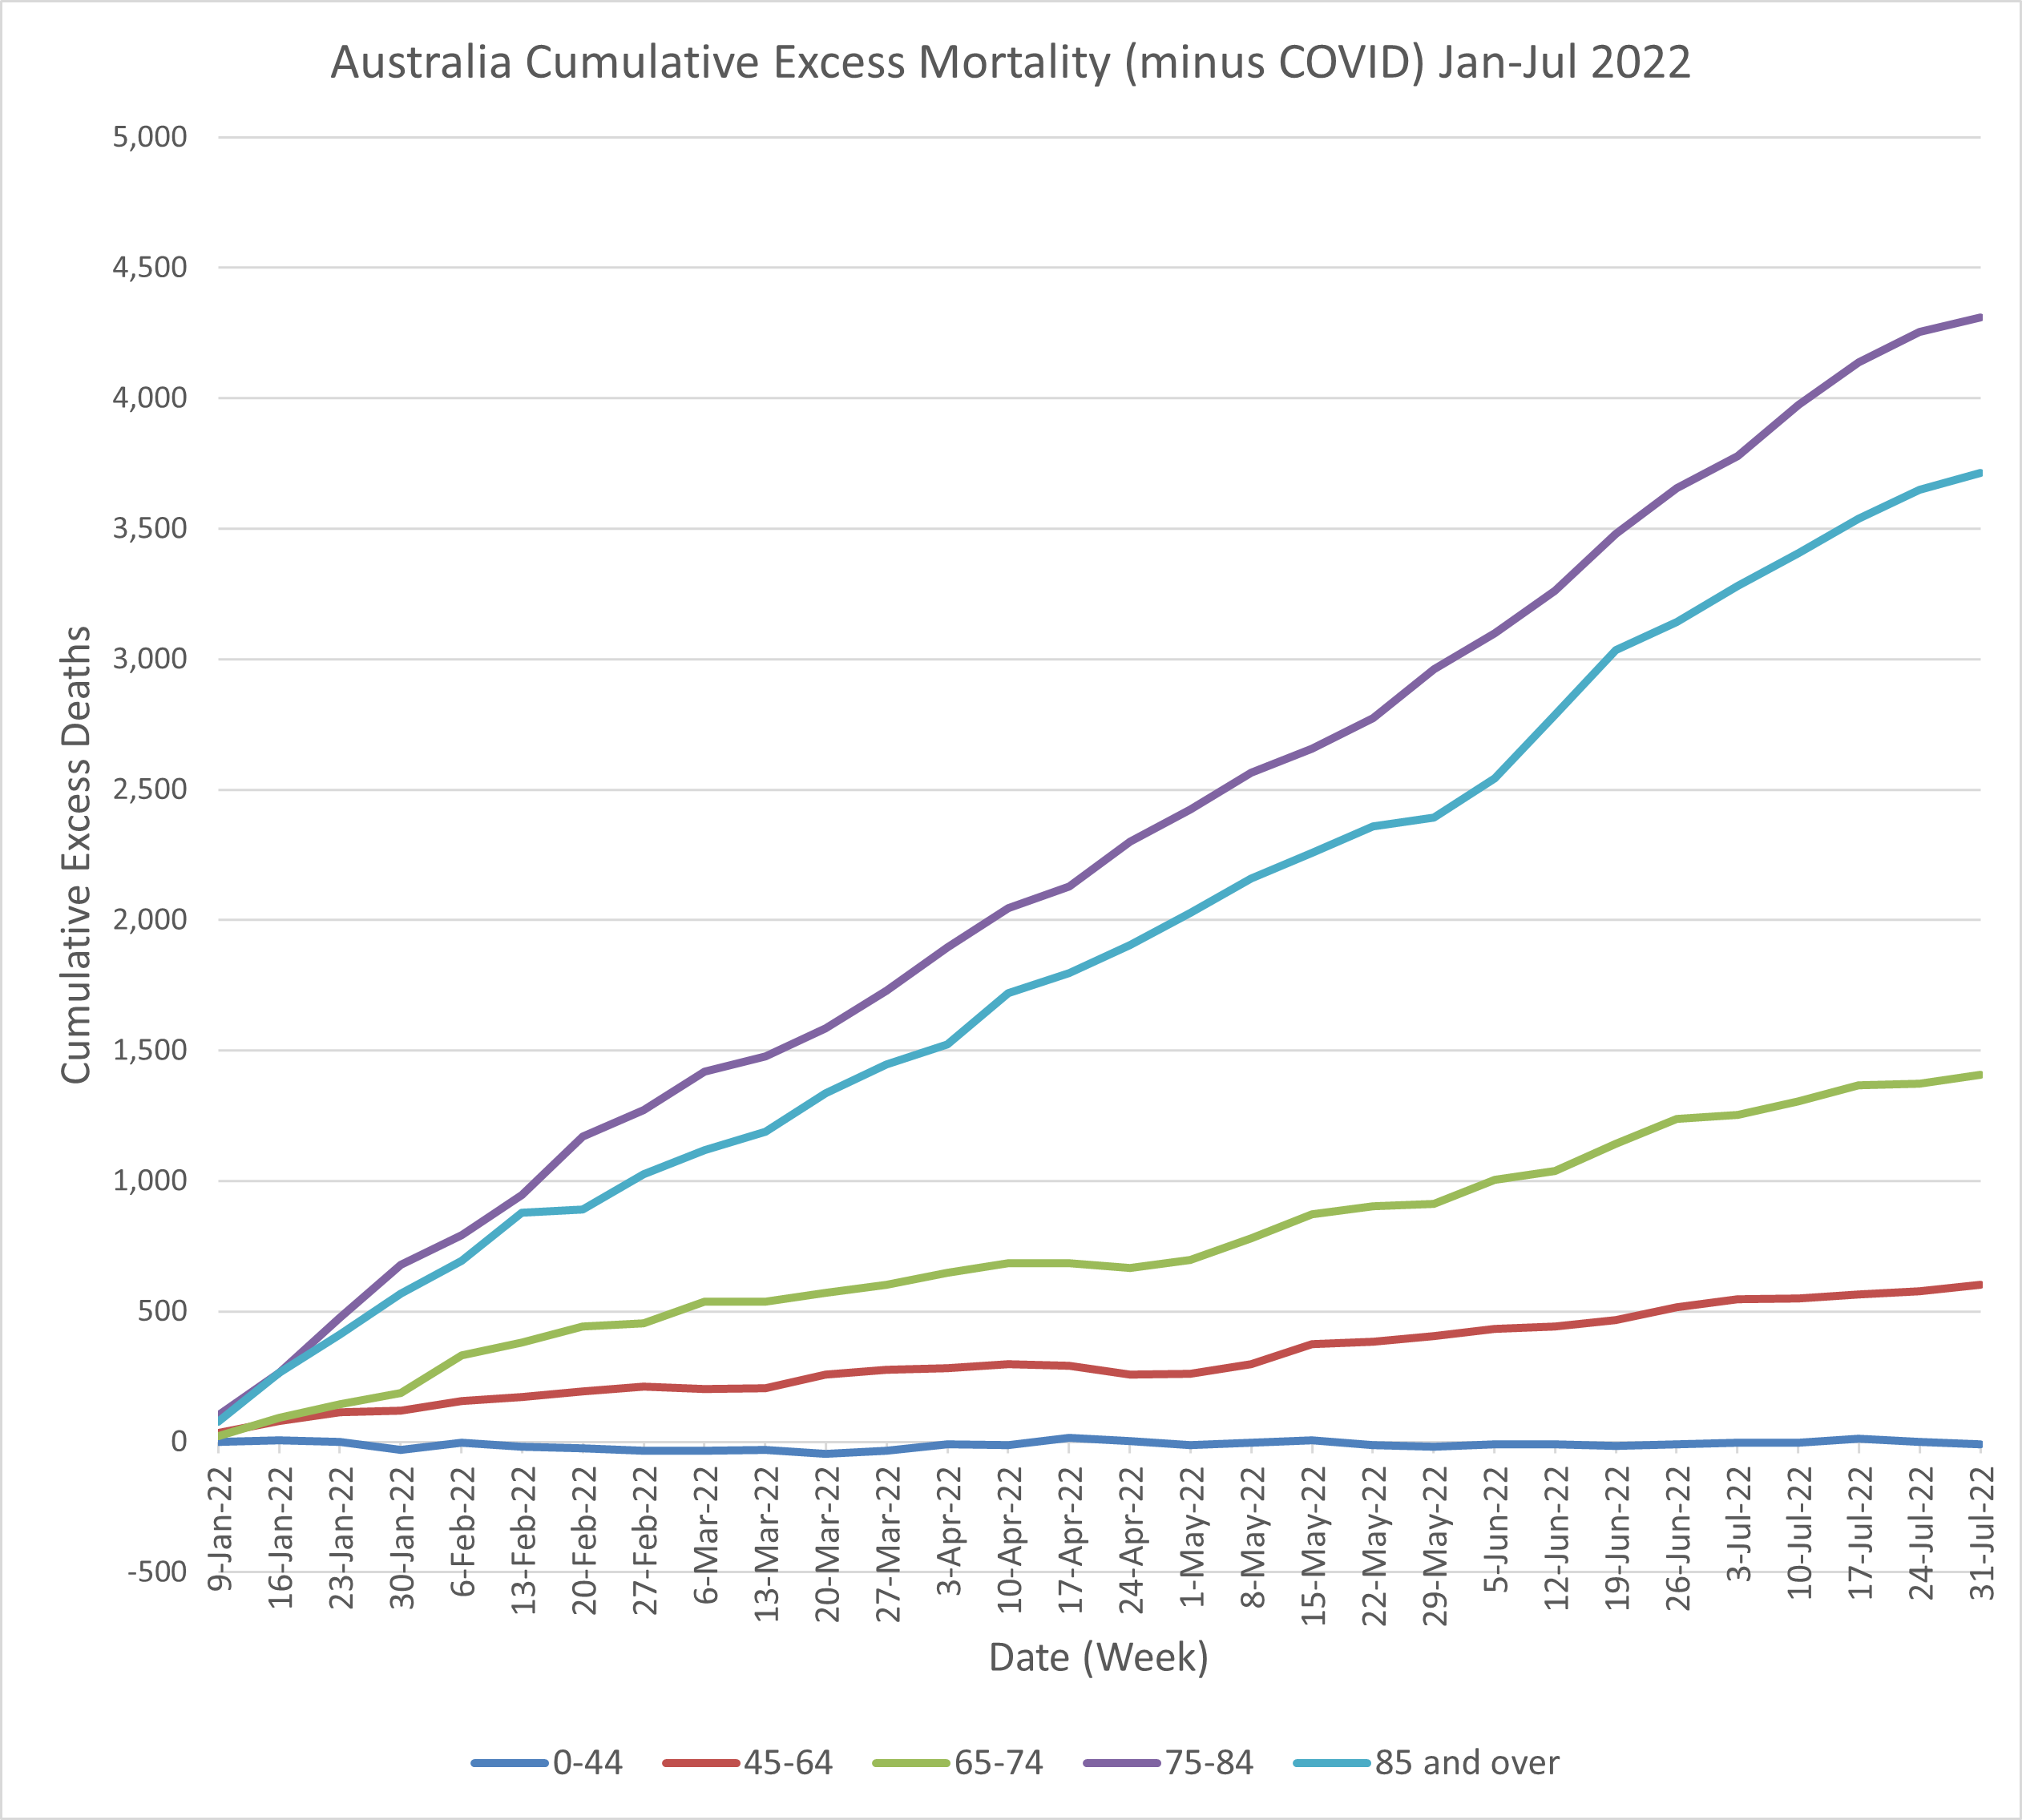
I haven’t included the last available month of data (August) as this most recent month is always subject to significant correction as mortality data reporting is subject to delay. This affects the most recent months reported to the ABS.
The Cumulative Excess graph adds the excess deaths week to week. If there were a fixed number of excess deaths week to week the lines would be straight with a slope determined by the weekly excess number.
The number at the end of the graph on the right is the total number of deaths above the baseline for the period on the x axis. For example, for ages 45-64 that number is approximately 600. For reference the typical number of total deaths in this age range over this period in the baseline is approximately 12,000. This is therefore a 5% increase.
My observations
For the lowest age band, up to age 44 there is no indication of excess deaths. However, this is a wide age band. There could be increases and decreases in certain age ranges within this band.
For all other ages the excess just keeps going up. Somewhere between ages 45 to 64 Australian’s health has been affected. Remember COVID deaths have been removed. We also know that COVID has significantly less impact on people under 65 compared to above.
We could also expect the cumulative excess lines to turn back downwards in the case of older deaths. Say the most vulnerable are subject to disease and their deaths are brought forward in time. They therefore don’t die later and we expect a mortality deficit later on. There is no sign of this occurring.
If the excess line becomes horizontal it means no excess deaths. We see some weeks where it slows down. I note that it is not possible to draw too much from local variations because of the way I have calculated the weekly COVID deaths. However, I have observed that the weekly age breakdown of COVID deaths is fairly consistent.
In the 75-84 years age range we have 4300 excess non-COVID deaths. The baseline is 24,000. That’s an alarming 18% increase!
Perhaps it’s easy to ignore these deaths, as when someone dies in their 80’s, people say well they had a good innings. But we still have a thriving elderly population in this age range. Only a certain percentage of that population are expected to die.
In the UK and Europe the excess deaths are also occurring and Dr John Campbell has raised the alarm in his videos. It has been raised in the UK parliament. In the UK it was running at the order of 1,000 excess non-COVID deaths per week. The UK data is more up to date than here and in a recent Dr John videos he notes that fortunately the excess is slowing down.
In Australia there are a handful of decent politicians who are raising this catastrophe in parliament. Senator Gerard Rennick is one of them. He has been working tirelessly in various senate committees, and links to various sessions can be found on his website.
In this one he is very angry because a vote has been lost to drop mandates for unvaccinated people.
Also linked from his website here.
It is very disturbing that Green’s senators are laughing and disparaging of his concerns, including excess mortality, in parliament. Clearly thousands of people dying is a joke to them.
On a personal note, I was helping out at a social function organised by a friend in NSW Fire and Rescue, basically as staff, and Gerard Rennick had been invited to speak. I noticed that he went out of his way to say hello and say thankyou to us helpers. I have to look up what political party he is in but I can say he seems a very decent person.
One of the honourable Australian Senators leading the effort to get to the bottom of the catastrophe is Senator Alex Antic from South Australia (SA).
He made a Freedom of Information (FOI) request to SA Health to obtain “an age stratified breakdown of all presentations to and admissions to, hospitals operated by the Department of Health and Wellbeing (SA Health) for cardiac or cardiac related symptoms or conditions, for each month during the period 1 January 2018 to 20 October 2022.”
The document provided can be found on this page.
I note I didn’t find it on the SA Health register when I looked there. I thought they were obliged to provide all FOI requests to the public. Something I have learnt about these Freedom of Information requests is that somehow you have to know what document to ask for. Asking for some relevant data will not be provided. If it hasn’t been put in a document, you can’t get it. I think a document can include a spreadsheet. In that case the spreadsheet, if provided, is printed out and scanned. So, I’ve manually entered the data. Here it is for Emergency Department (ED) presentations.
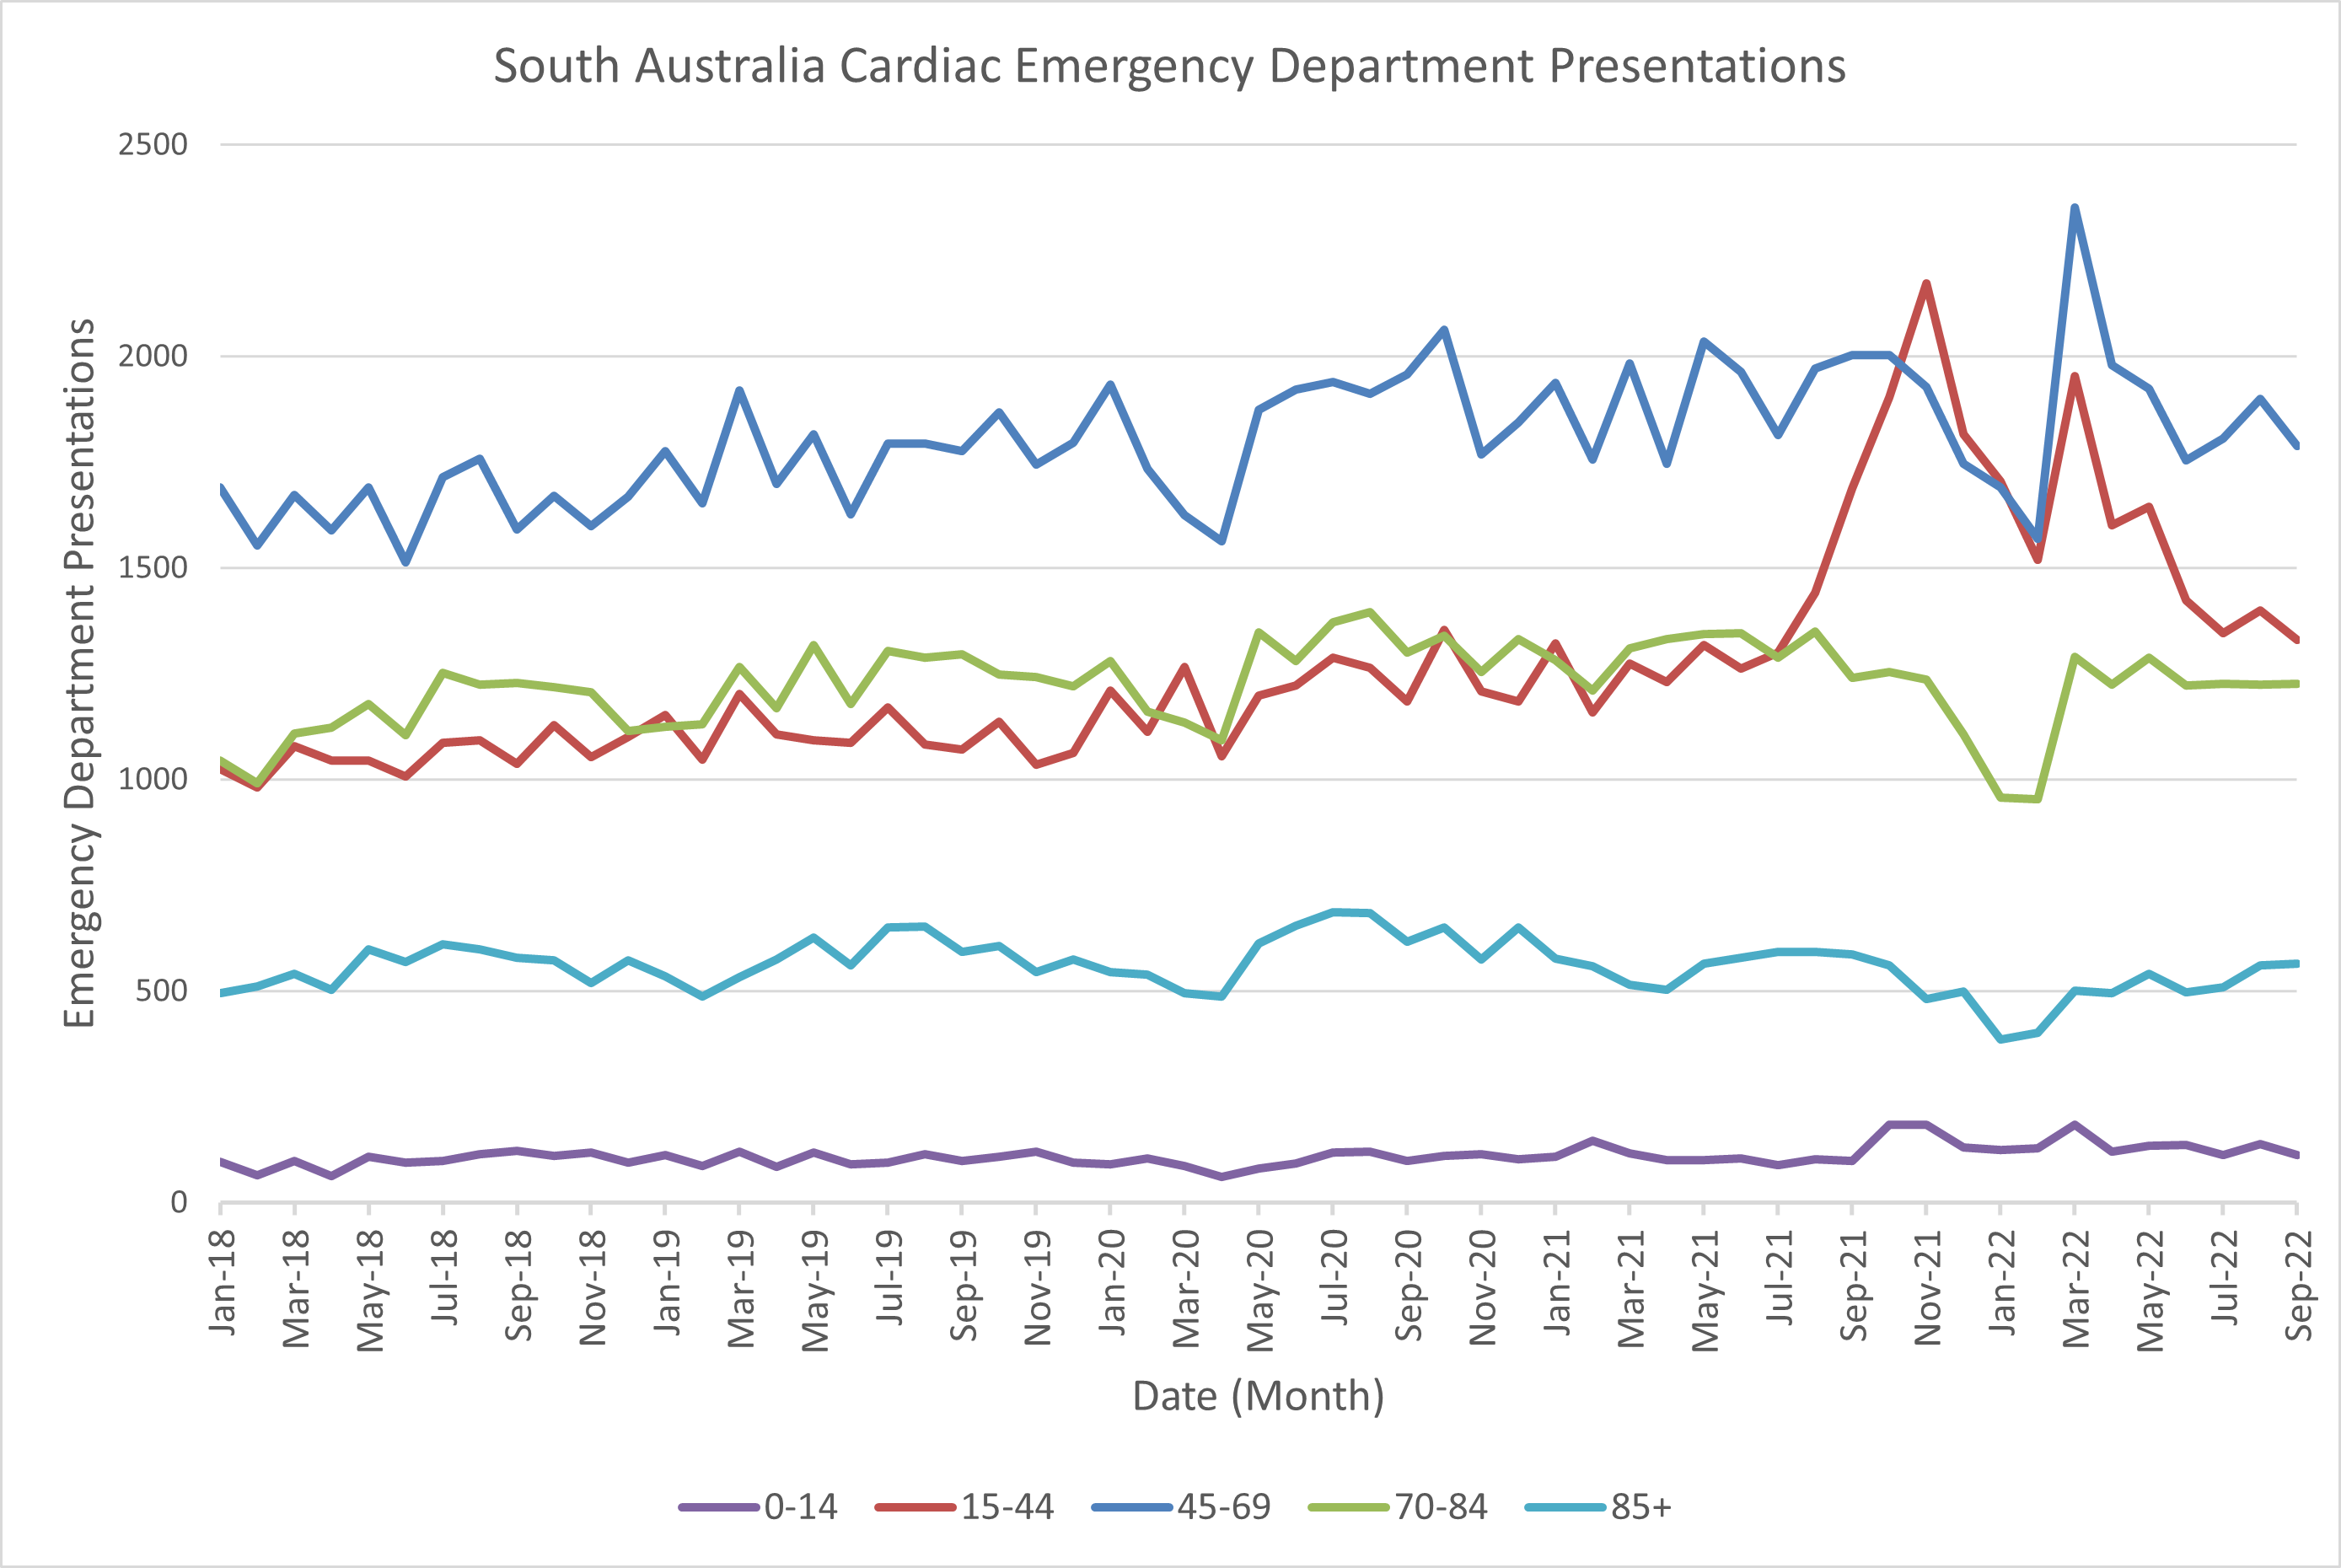
Prior to July 2021 the trend for all ages looks consistent. It is basically following a linear trend with random variation month to month.
The most striking observation is the sharp increase, starting at August 2021, for the red line, which is ages 15-44. This does not come back to baseline till June 2022. Of course, we know this range includes the most at-risk age group for myocarditis resulting from mRNA injection, ie young men 15-24. There are thousands more presentations than expected over this period.
There is also a sharp peak in ages 45-69 in March 2022. Could this be this related to the 3rd dose rollout? That peaked end of January, start February 2022, noting this was also time of the first Omicron wave.
Some other strange features are dips in January - February 2022 for ages 70-84 and 85+. The dips also appear in the same months for ages 15-44 and 45-69. This was the peak of first Omicron wave. I can’t imagine that people held off presenting at hospital with cardiac symptoms and waited till the next month. Maybe people were presenting for other conditions rather than cardiac? We would need to see numbers for all hospital presentations.
Not all people presenting are admitted to hospital. The numbers for admissions are shown below.
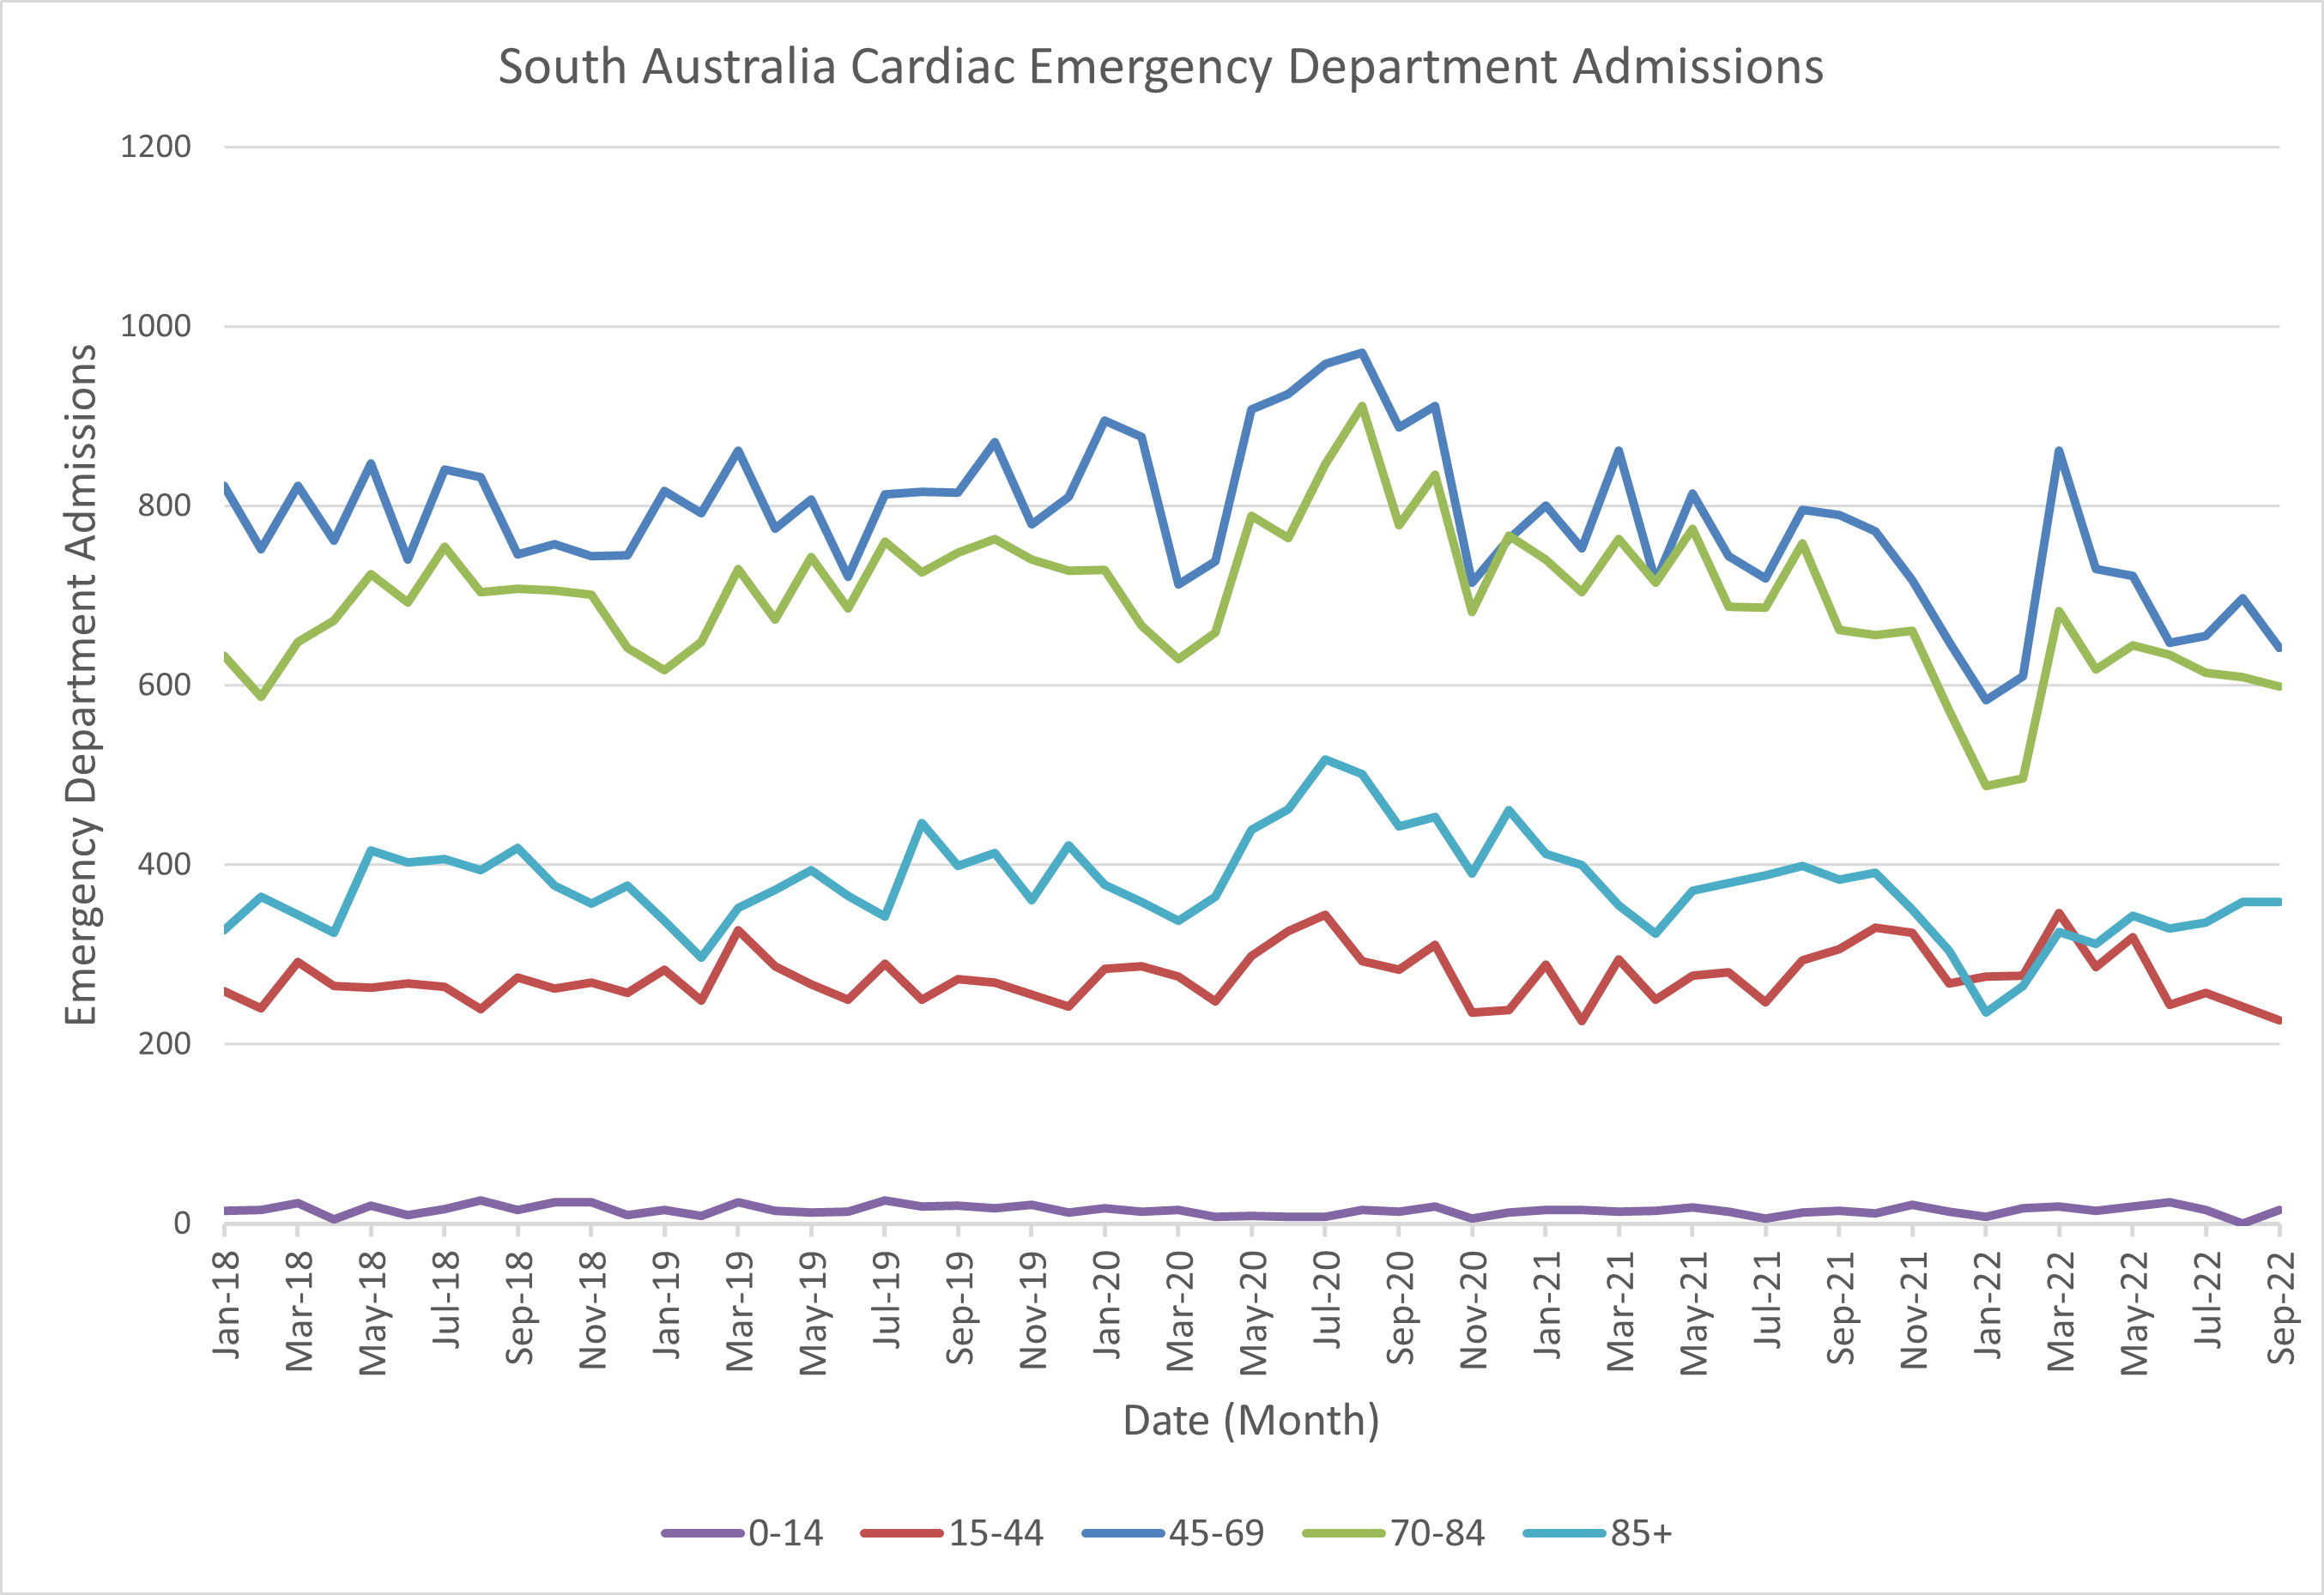
Strangely we don’t see the same peak for the ages 15-44 in ED admissions. So could all these extra presentations be for some new cardiac condition? That doctors don’t know what to do with?
Authorities, particularly the CDC, have tried to say that the risks of cardiac adverse events is greater from COVID infection than for mRNA injection. This is rubbish. I refer to this presentation by Deanna McLeod from the Canadian COVID Care Alliance. I saw it referenced in a Dr Byram Bridle substack. He is a Canadian Professor of Viral Immunology and his articles are very important.
It is a perfectly put together video presentation and if you have time, I recommend watching it all the way through. It shows the techniques the CDC use to manipulate the numbers. She notes she has worked in the pharmaceutical Industry and knows of the tricks that are used. Her presentation refers to a number of relevant studies including a large Israeli study, pre vaccines, which showed that there was no increase in myocarditis due to COVID above the background.
There is a lot to unpick in this SA data. From August 2021 till June 2022 there was an abnormal increase in presentations at the Emergency Department for cardiac health issues in people under 44. These did not lead to admission to hospital. It is therefore possibly due to some new cardiac condition. While it might be said that since they were sent home, nothing to worry about, if you go to hospital with chest pain or abnormal heart rhythm, it is something serious. Presumably these people will be referred to cardiologists for follow-up.
There is also no evidence of people not presenting at hospital during the pandemic when they have some cardiac issue and these people suddenly dying and contributing to the excess mortality.
Legacy media commentary has suggested that the Excess Mortality is due to people not presenting for healthcare during times of lockdowns. There is no evidence of this in this data. There are two months, Feb-March 2022 (after lockdowns ended), in older ages where there is a dip but in all other months patterns are consistent since 2018.
This data gives us a peek into the health of the Australian population. We need so much other data to be able to tell what is going on. I’d welcome any suggestions of what might be happening here in the comments.
Summary
We are seeing alarming excess non-COVID mortality in the Australian population for all ages above 44, In ages below this excess mortality is not observed but we are seeing signals of cardiac issues in younger ages from data obtained under FOI from one state in Australia.
Please pray for Australia.
Thanks good overview.. Gerrad Rennick and Alex Antic are both Liberal... they are the sort of people you want to see in government.. like George Christensen and Malcolm Roberts, Alex is a Christian too..
I do pray for Australia and it’s the most important thing we can do, glad your encouraging that..without God we can do nothing...but I think the western world is facing a Roman 1 situation... given over to a depraved mind.. where hearts are hard and cold... we need mercy.. but people need to understand how bad things can get.. Look at deaths and depravity under Hitler Stalin, Lenin, Mao ... the people orchestrating these things are no different to them..
Thank you for your work...
In relation to FOIs being published on disclosure logs - agencies and ministers must publish released information on disclosure logs within 10 working days of giving the FOI applicant access to the released information...This is a legislative requirement...
However, I have FOIed the TGA specifically many times and on several occasions they have 'forgotten' to published the released information on their FOI Disclosure Log...They do publish when 'reminded' to, but it's often only the applicant who knows that it hasn't been published...A transparent agency would have an FOI Disclosure Log that published every request, even those declined...This would help all researchers and the public would then be aware when an agency has failed to publish released information...