

Australia 2023 Mortality Data
and Easter Greetings

Happy Easter dear readers. I was pleased to join my friend Father Dave’s online Easter service yesterday.
Father Dave has some very learned biblical scholars participate in his virtual service. I’m not one of them. I figure I represent the layperson’s view. For those interested Reverend Joy’s Easter homily at 43 minutes is terrific.
There’s always some chit chat at the beginning and it includes challenges people have been having with the health system in Australia.
I’ve had in mind to do one of my write-ups on “Stupid Studies”, but they have been coming in so fast in 2024 that I keep procrastinating on the write-up because something more stupid comes in. These range from the Lancet study of a man who supposedly took 217 COVID jabs, touted by legacy media as showing that jabs can’t be bad for you, to a study showing that gaming continuously for over 3 hours leads to physical problems in children such as eyestrain and posture problems.
Who would have thought?
It also seems that just about anything is causing heart problems. Apparently intermittent fasting is now a culprit! There are many more subtlety stupid papers using tricks to come up with desired conclusions. I’ll do that write-up soon.
Inquiry into Excess Mortality
Australian Senator Ralph Babet has successfully achieved a motion for an inquiry into excess mortality in Australia on a fifth attempt. Apparently, this will be the first such inquiry anywhere in the world. I have gained an appreciation of the work and effort that goes on in the background by the good Senators and their staff to make things happen. The parliamentary committee will report by the end of August, so we are waiting to hear what the process will be for submissions and hearings. A good write-up on this by Rebekah Barnett is found here.
2023 Mortality Data
The Australian Bureau of Statistics (ABS) last week released provisional mortality data covering up till the end of 2023. Latest Release, dated 26 March 2024, with data up till end December 2023.
I last reported on the data up till end of September here. Using a simple model the data was tracking to a cumulative excess just over 40,000 since the pandemic started.
Recapping the simple method: We calculate Cumulative Mortality. We progressively add deaths week to week. This always goes up over time, in our case from 2015. When everything is normal this Cumulative Mortality follows a simple upwards curve. In normal times the Cumulative Mortality smoothly hovers about the fitted curve, above a bit during winter season and then down a bit. We can predict forward using this simple curve from some time point which we want to use as a reference. We calculate a Cumulative Excess as the difference between the actual cumulative sum and the expected cumulative sum based on the fitted curve.
We fit the simplest curve we can to the Cumulative Mortality to make our prediction. Look at the data up till March 2021.

We have some confidence that we have a reasonable model. If nothing changed after March 2021 with this model we could expected with certain confidence, in future times, that the values we calculate will lie within +/- 3,600 of the zero excess line (Standard Deviation is 1,800).
We know that 2017 was a bad influenza year and the measure peaks during that season. The following year is much less. This is a typical pattern for deaths in the elderly from respiratory virus.
Let’s have a look at where we are up to now.
Data to End 2023 – Simple Model

At the end of 2023 the Cumulative Excess is approximately 44,000.
Super Sally wrote a substack last week on this latest ABS data. She comes up with a Cumulative Excess of 46,000 using her own method. Let’s say for now we estimate the excess deaths to be between 40 and 50 thousand in Australia.
Observations:
There is a lot to unpack in this data.
Since April 2021 this curve has not turned downwards once. This is alarming. Within this curve there must be an effect that wants to pull it back downwards. That is the people who died from or with COVID who were already close to death. These are the people who would have perhaps died in a bad influenza season slightly earlier than otherwise. We know the people who have their deaths attributed to COVID have a median age above the median age of death from all causes for the whole population. We know the people who die from or with COVID typically have multiple comorbidities.
But our curve keeps going up. It could be that more COVID deaths keep pulling the curve upwards, counteracting deaths pulled forward. The question is are there enough of these? Or are there other factors continuing to pull it upwards?
By the time the first major COVID wave hit Australia in January 2022 the excess is greater than the worst influenza season in the last decade. The number of COVID deaths in Australia by Jan 2022 is not enough to account for this. COVID was not prevalent in the community until January 2022 so we can’t blame undiagnosed COVID side effects.
I noted in my previous article that the Cumulative Excess curve appeared to be flattening out but pointed out that we need to keep in mind that the most recently reported provisional data is subject to change as there is delayed reporting of deaths. I looked at the difference between the previous provisional data and this latest. In the graph below you can see the extra deaths that get recorded up till end of September, by the time of the December data. When we think it is flattening out it may still be increasing.
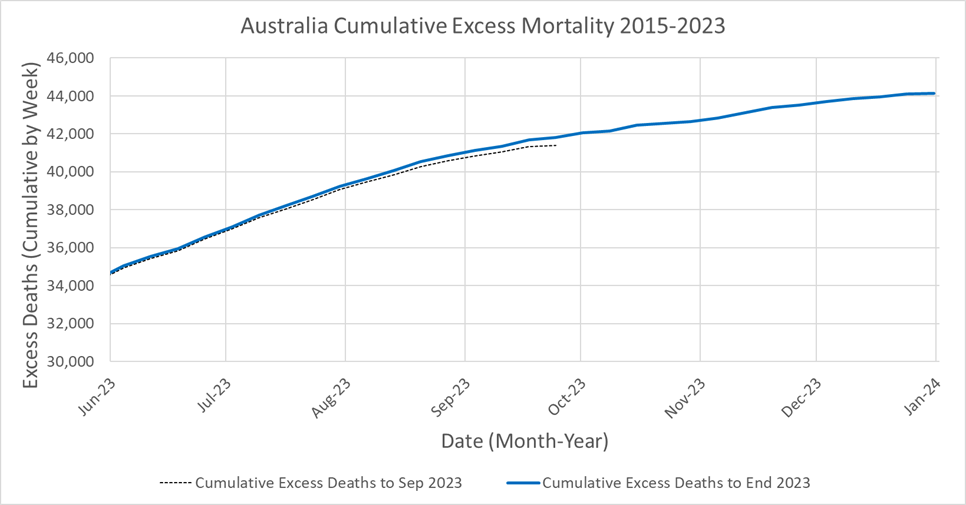
I note that flattening out doesn’t necessarily mean everything is good. It should be going back down.
More Sophisticated Models
In my work for the AMPS “Too Many Dead” book I cover a range of time series prediction methods I used on the mortality data I acquired. Ultimately all these methods will be important to apply to the latest data. When we come up with estimates using these sophisticated methods it’s still important to compare with simple methods. This gives us a feel that we understand what is going on. If they are wildly different we may need to look deeper. The simple model may indeed be too simple and not taking into account certain factors. On the other hand the complex models could be overshooting in an attempt to fit data perfectly. Very often the simplest model is the best one.
While I suspect we have a reasonable estimate of the extra number of deaths that have occurred in Australia, had there not been a pandemic and ensuing panic of unvalidated protection measures, we don’t have insight into where and how these deaths are occurring. We need to do the detailed analysis for that.
There is a desire by the bureaucracy, responsible for applying measures that were largely ineffective, to attribute all the excess to COVID.
This is far-fetched.
The vote in parliament was swayed by independent and smaller party Senators who chose to vote the way they thought was right and we can be grateful for that.
Lot’s of work to do. Happy Easter and God Bless.
The man who has taken the 217 jabs asked his Doctor could he now have them administered in his legs, now he's complaining that his Pfizer killing him.💉💉💉
Thanks for the update. I‘ve shared this info to tumblr as well